


Food affordability Metrics: Linking scraped food prices data with household income in a Saudi Food Index

This empirical analysis aims to establish and examine a comprehensive Food Price Index for Saudi Arabia and offering insights into price fluctuations across multiple food categories and their economic impact on Saudi workers. This article draws from two main data sources in Saudi Arabia: 1) scraped food price data collected from major Riyadh supermarket chains and 2) average monthly wage figures from GASTAT’s Labor Force survey (LFS) (Q4 2024).
Methodology
In this article, I track prices across eleven distinct food product categories from February 19 to April 14, 2025. By collecting multiple price points for each category, I was able to then create a baseline price index of 100 and monitor subsequent price movements for each food item. This approach allowed us to gain a granular understanding of pricing behaviors that extends far beyond aggregate inflation indicators. In Figure 1, we can notice that the overall food price index showed a remarkable volatility before and during Ramadan. Beginning at the baseline of 100 pre-Ramadan, the index climbed to approximately 150 by mid-March (i.e. mid-Ramadan) before declining and ultimately stabilizing around 120 by late March and further declining to 110 by mid-April (i.e. approximately two weeks after Ramadan).
Figure 1. Food Price Index based on scraped food items

I then analyzed the Food Price Index for each category shown in Figure 2. The most pronounced pricing dynamics were observed in the Meat and Fresh Food categories. Specifically, Meat prices demonstrated high volatility, with price indices fluctuating dramatically between 200 and 600, peaking in mid-Ramadan at nearly six times the baseline value, which is likely due to their high consumption during Ramadan and the days leading to AlEid. The Fresh Food category followed a similar price trajectory, albeit at a smaller magnitude, with significant price increases during March.
Figure 2. Price trends per food item category

Economic impact on households
To meaningfully interpret these price fluctuations in context, I merged my scraped price data with monthly salary data from the LFS (Q4 2024). This data integration allows us to compute a proxy of what percentage of a typical Saudi worker’s monthly income would be required to purchase a standard food basket throughout the analyzed time period.1
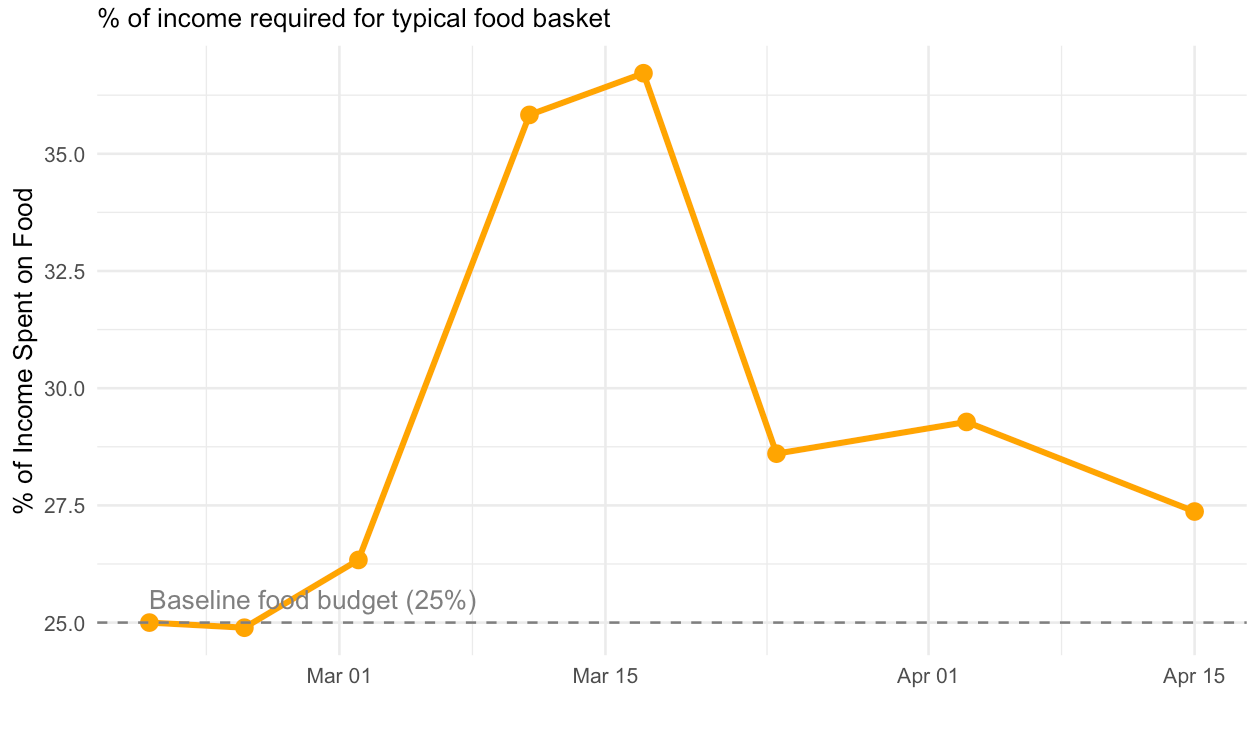
Figure 3 suggests that the percentage of income required for a typical food basket expanded from a baseline of 25% to a peak of 37% by mid-Ramadan, before moderating to 29% by early April (i.e. AlEid week) and further declining to 27.5% by mid-April.
Figure 3. Household food budget pressure
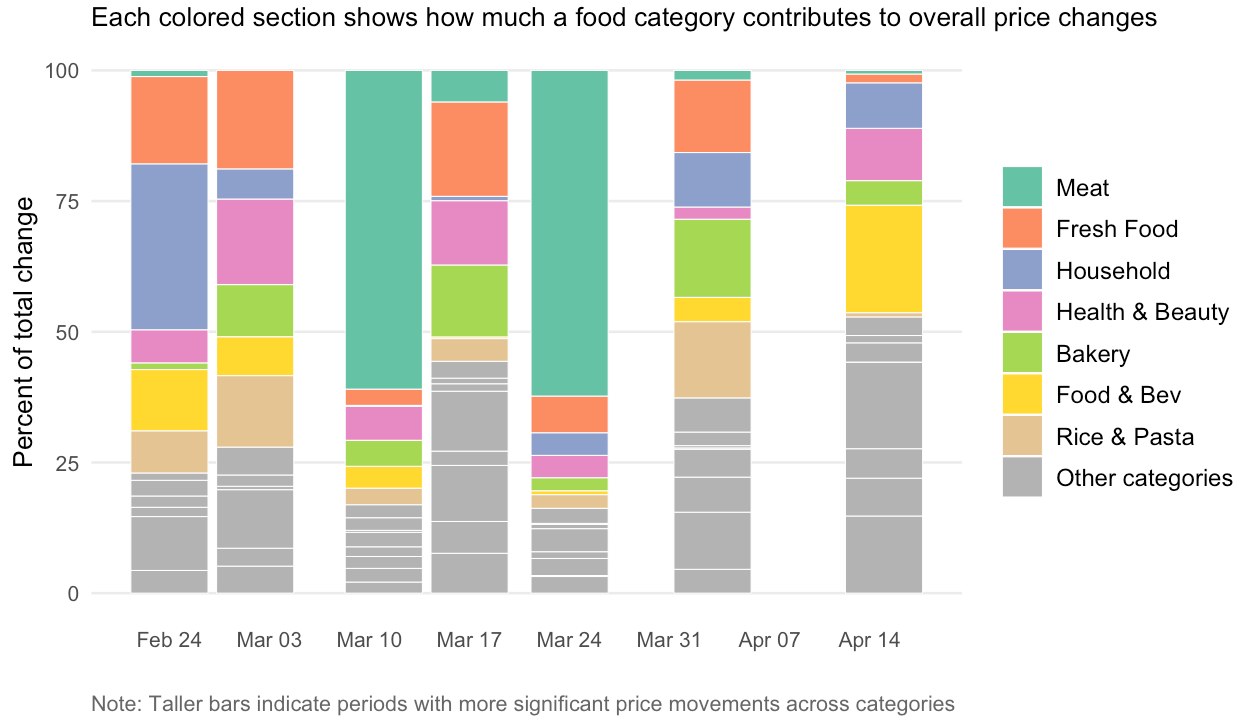
Which food categories contributed the most to price changes?
The graphical analysis reveals that Meat products were the dominant driver of price increases, particularly during the March 10-24 period when they constituted over 60% of price changes in mid-March. Fresh food was the second most significant contributor, accounting for approximately 20% of price movements in late February and early March.
Figure 4. The contribution of each food category to price changes
Seasonal impact of Ramadan
The data clearly indicates that the beginning of Ramadan on February 28 (the dashed line in the Food Price Index graph) triggered the start of significant price increases during the holy month. Prices remained relatively stable before Ramadan, then climbed steadily throughout the first two weeks of the holy month, peaking in mid-March before beginning to decline as Ramadan progressed.
Policy Recommendations
The analysis points to two primary policy interventions:
There is a clear need for enhanced price transparency mechanisms. Entrepreneurs and policymakers may potentially consider developing real-time pricing monitoring systems that provide consumers with actionable insights into market dynamics.
Implementation or experimenting in policy pilots in price stabilization measures for critical categories like Meat and Fresh Food would significantly reduce household budget pressure during Ramadan and other periods of heightened demand such as Eid AlAdha.
Limitations
While I attempted in this article to provide granular economic insights, it primarily reflects urban pricing dynamics in Riyadh. Future research can expand to investigate regional variations and considering regional differences in terms of competition or consumer purchasing power across Saudi Arabia.
Conclusion
This analysis establishes a Food Price Index that shows a significant pricing volatility across food categories during Ramadan. The economic impact on households was noticeable, with food expenditure requirements temporarily rising from 25% to 37% of the monthly income.
All food prices data are compared against average monthly wages from the LFS Q4, 2024.